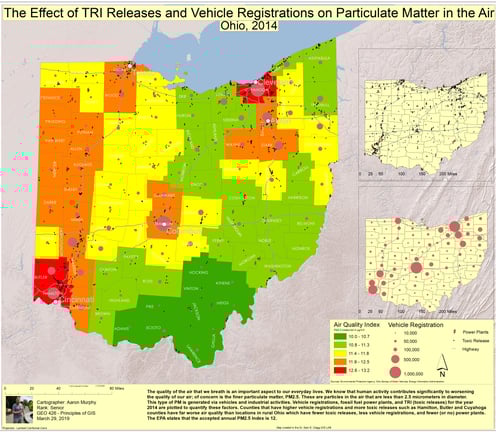
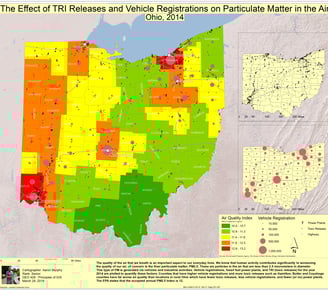
The Effect of TRI Releases and Vehicle Registrations on Particulate Matter in the Air
This project was for Principles of GIS / GEO 426 Marshall University
Air pollution has a significant impact on the health of society, particulate matter and ozone are leading causes of premature deaths of human population. The article does notes “Although other anthropogenic air pollutants are recognized as causes of adverse health impacts, ground level PM2.5 and ozone exposure is currently considered the most significant known cause of early deaths related to poor outdoor air quality” (Caiazzo, Ashok, Waitz, Yim, & Barrett 2013, page 198). It is important to know the point source of pollutants and this is where the authors utilize a WRF model to factor in weather factors like temperature, wind, and humidity which have significant impacts on the spread and magnification of. They furthermore break down into six source categories. Electrical power generation, industry, commercial/residential, road transportation, marine transportation, and rail transportation. The factors that I will be looking and highlighting in this project will be related to electrical power generation and road transportation.
When looking at transport, “Road transportation is responsible for a PM2.5 population-weighted concentration of 2.30mgm3 in U.S., representing the largest contributor to PM-related impacts” (Caiazzo et al., 2013, page 202). Vehicle ownership and transport is important in the United States; and this model implies that this is one of the top pressing issues to face in regards to particulates in the air.
Concerning electrical generation pollution, you can see in the maps of the study that a rather high anomaly is noted across the Ohio Valley and eastern United States in general. The article states that eastern power plants utilize coal with higher sulfur content than that of western powerplants; this magnifies the impact of pollutants nearer to the surface. This is second to road transport. The article notes: “electric power generation is responsible for a population weighted annual mean PM2.5 concentration of 2.27 mg m3. Given the discrete distribution of power plants, the contribution of this sector is less ubiquitous with respect to road transportation” (Caiazzo et al., 2013, page 202).
Sources:
Centers for Disease Control and Prevention. Environmental Public Health Tracking Network. Annual PM 2.5 Level (Monitor + Modeled). Accessed From Environmental Public Health Tracking Network: www.cdc.gov/ephtracking. Accessed on 02/08/2019
Caiazzo, Ashok, Waitz, Yim, Barrett, Air pollution and early deaths in the United States. Part I: Quantifying the impact of major sectors in 2005, Atmospheric Environment, Volume 79,2013, Pages 198-208, ISSN 1352-2310, https://doi.org/10.1016/j.atmosenv.2013.05.081.
“U.S. Energy Information Administration - EIA - Independent Statistics and Analysis.” ELECTRICITY DATA BROWSER, EIA, www.eia.gov/electricity/data/browser/#/topic/1?agg=2,0,1&fuel=vvg&geo=00002&sec=g&freq=M&datecode=201810&rtype=s&rse=0&maptype=0&pin=<ype=pin&ctype=linechart&end=201810&start=200101.